
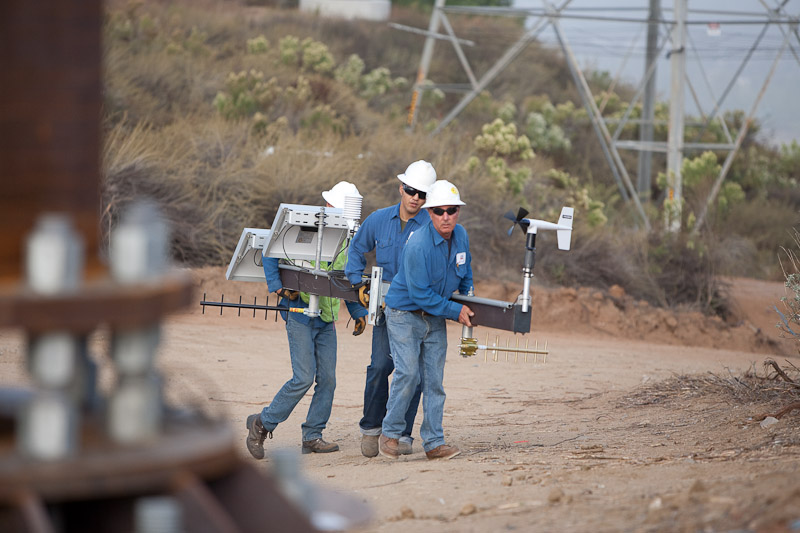
A decade ago, our company hired our first meteorologist and started building our own weather station network, so we can closely track how temperature, humidity and winds affect the power grid and plan accordingly to reduce wildfire risk.
Over the years, we have continued to expand and upgrade our weather network. Today, we have 191 weather stations, up from 177 in 2018. In the past 12 months, our meteorology team added 14 stations in the Poway, Rancho Santa Fe and Olivenhain areas, as well as one at the Living Coast Discovery Center in Chula Vista for educational purposes.
The new stations (with the exception of the one at the Living Coast) are located in so called wildland-urban interfaces – areas of concern where developments border coastal canyons or hillsides.
In addition to expanding the weather station network, we have upgraded its capabilities for more frequent data download. The newly installed electronics in about 100 of the weather stations has been upgraded to provide weather observations every 30 seconds, instead of every ten minutes. We will continue to modernize the weather network until all stations are able to report critical weather information every 30 seconds.
How Do We Determine Where to Put Weather Stations?
After each extreme weather event that results in Public Safety Power Shutoffs (PSPS), our meteorology team does an after-action review of our weather forecast leading up to a PSPS and the electric circuits that were shut off. As part of the review process, they determine where a greater density of weather stations would be beneficial to improve coverage in the future. If additional stations provide the granular coverage needed to reduce the number of customers affected, then the cost and effort are well worth it.
By looking at the geography and topography of our region’s landscape on Google Earth, our meteorologists are also able to see which areas have signature traits that are conducive to strong winds. After a physical inspection of the region, those areas are targeted for additional weather stations.
In the next two years, we plan to continue to add more stations to provide even more granular data to guide our decision-making process for PSPS. The more granular data we have on the specific weather conditions in a given area near our overhead power infrastructure, the more surgical we can be in de-energizing power lines and minimizing impact to residents and businesses.
“San Diego County has a diverse landscape that modifies wind flow. You don’t know the wind is there until you measure it with a weather station. We are really trying to capture all the windy areas in the county to ensure we have the best understanding of the conditions impacting our energy infrastructure so we can make a good decision,” said Chris Arends, meteorology program manager at SDG&E.
Leveraging Data For Simulations and Forecasts
Our network of weather stations collects approximately 200,000 pieces of weather data daily. Over the past decade, the network has generated 700 million pieces of data. Using sophisticated computer algorithms and supercomputers, we are able to leverage the historical treasure trove of data to run wildfire simulations to determine which areas would be at the greatest risk of catastrophic wildfires.
In addition, our historical weather database has been leveraged to create a Vegetation Risk Index, which ranks the risk tree failures pose to individual circuits under various weather conditions.
What Do We Know Now that We Didn’t Know Before?
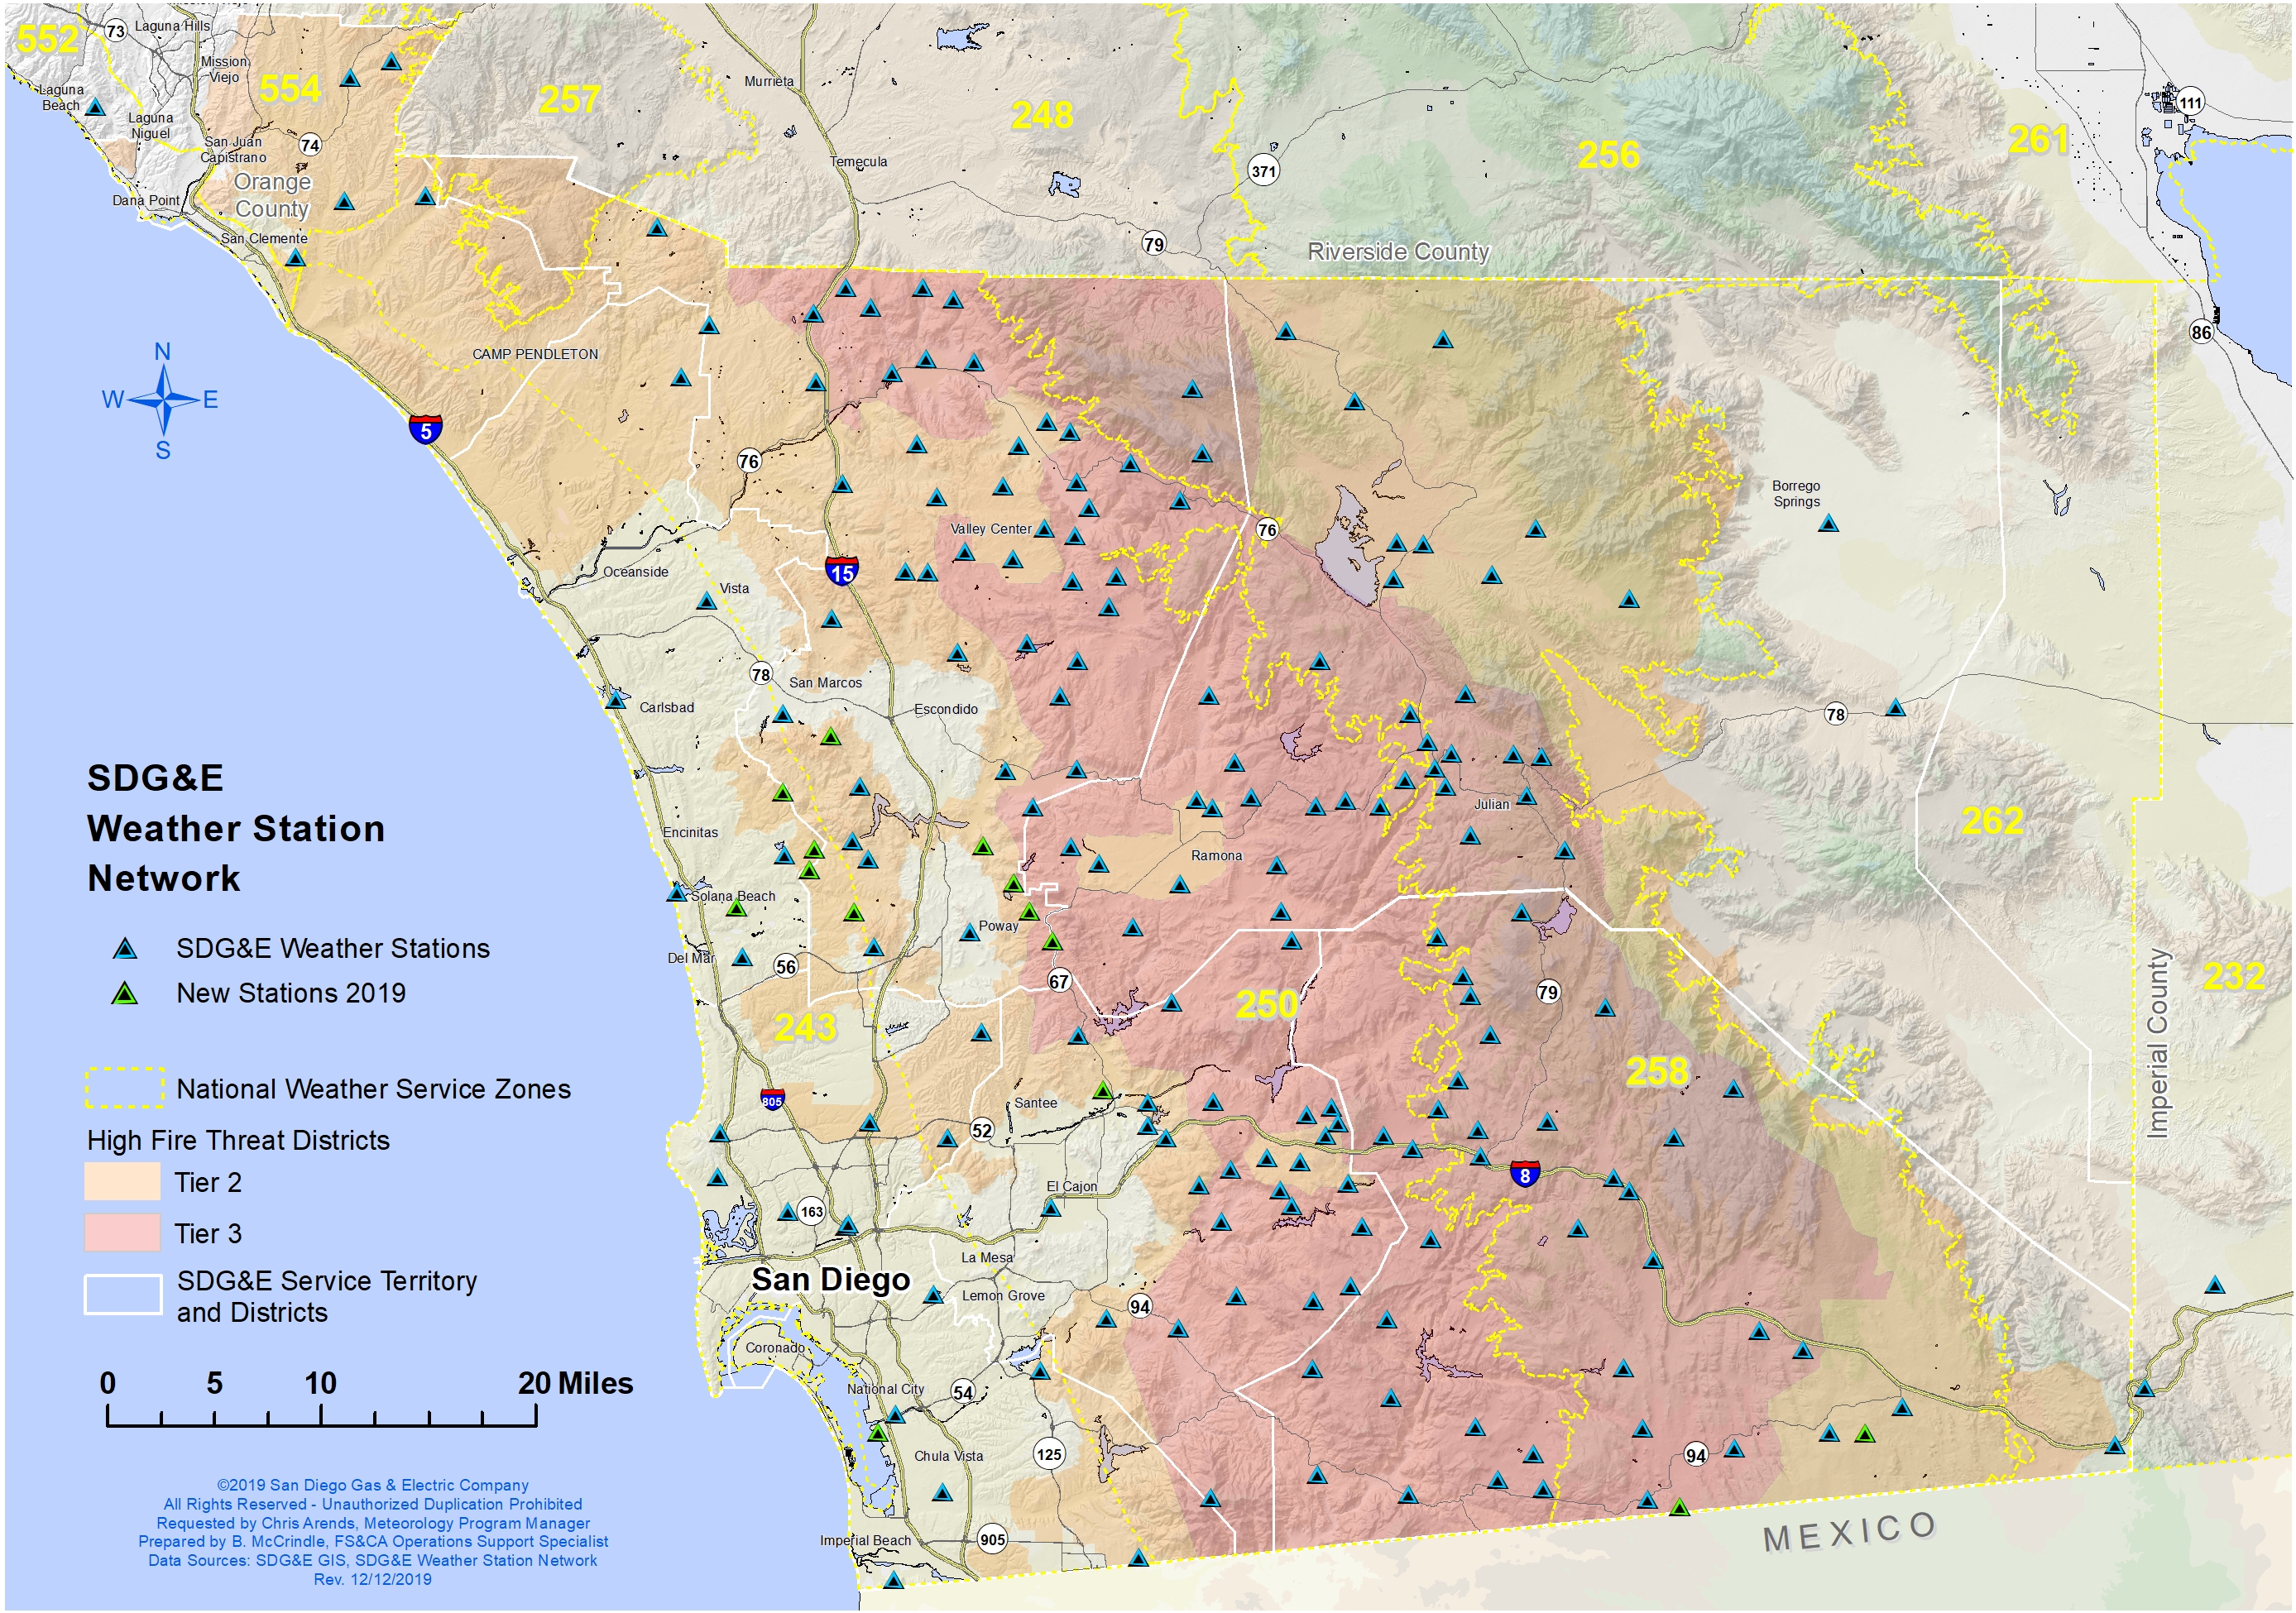
When we first started building our weather network, the stations were exclusively located in what are known as Tier 3 areas – areas that face the highest fire threat. The vast majority of the Tier 3 areas are in the backcountry. The new stations are located in Tier 2 areas, which face elevated fire threat.
Over time, we have learned a lot from our weather stations. Our weather stations have clocked hurricane-force winds – over 100 miles an hour – leading us to strengthen our design and engineering standards for power lines and poles based on local known conditions.
We also now know that the conventional wisdom about where you find the strongest winds isn’t true. In the past, there was a belief that the strongest winds were located in the canyons and passes, where winds are forced into funnel by the geography. What our weather stations have taught us is that the strongest winds actually are often found on down slopes of mountains.
“Think of winds as a dense fluid that flows over the mountains and generates wind conditions similar to rapids in a river. As it descends down the mountains from higher elevation to much lower elevation, it picks up speed and it heats up, which dramatically drops the relative humidity.” Arends said.
For More Information
Information collected by our weather station is made available to the public. Visit https://sdgeweather.com/ to learn more.